Magi, A 2D Reddit
54 views
June 29, 2026
Even though we typically explore the internet through a list, in the minds of its original creators, I would bet they viewed it as something two-dimensional, network is in the name after all.
Perhaps it was all just a matter of lacking the tools, or lacking performant-enough tools. And, if that's the case, maybe Magi could fill in the gap.
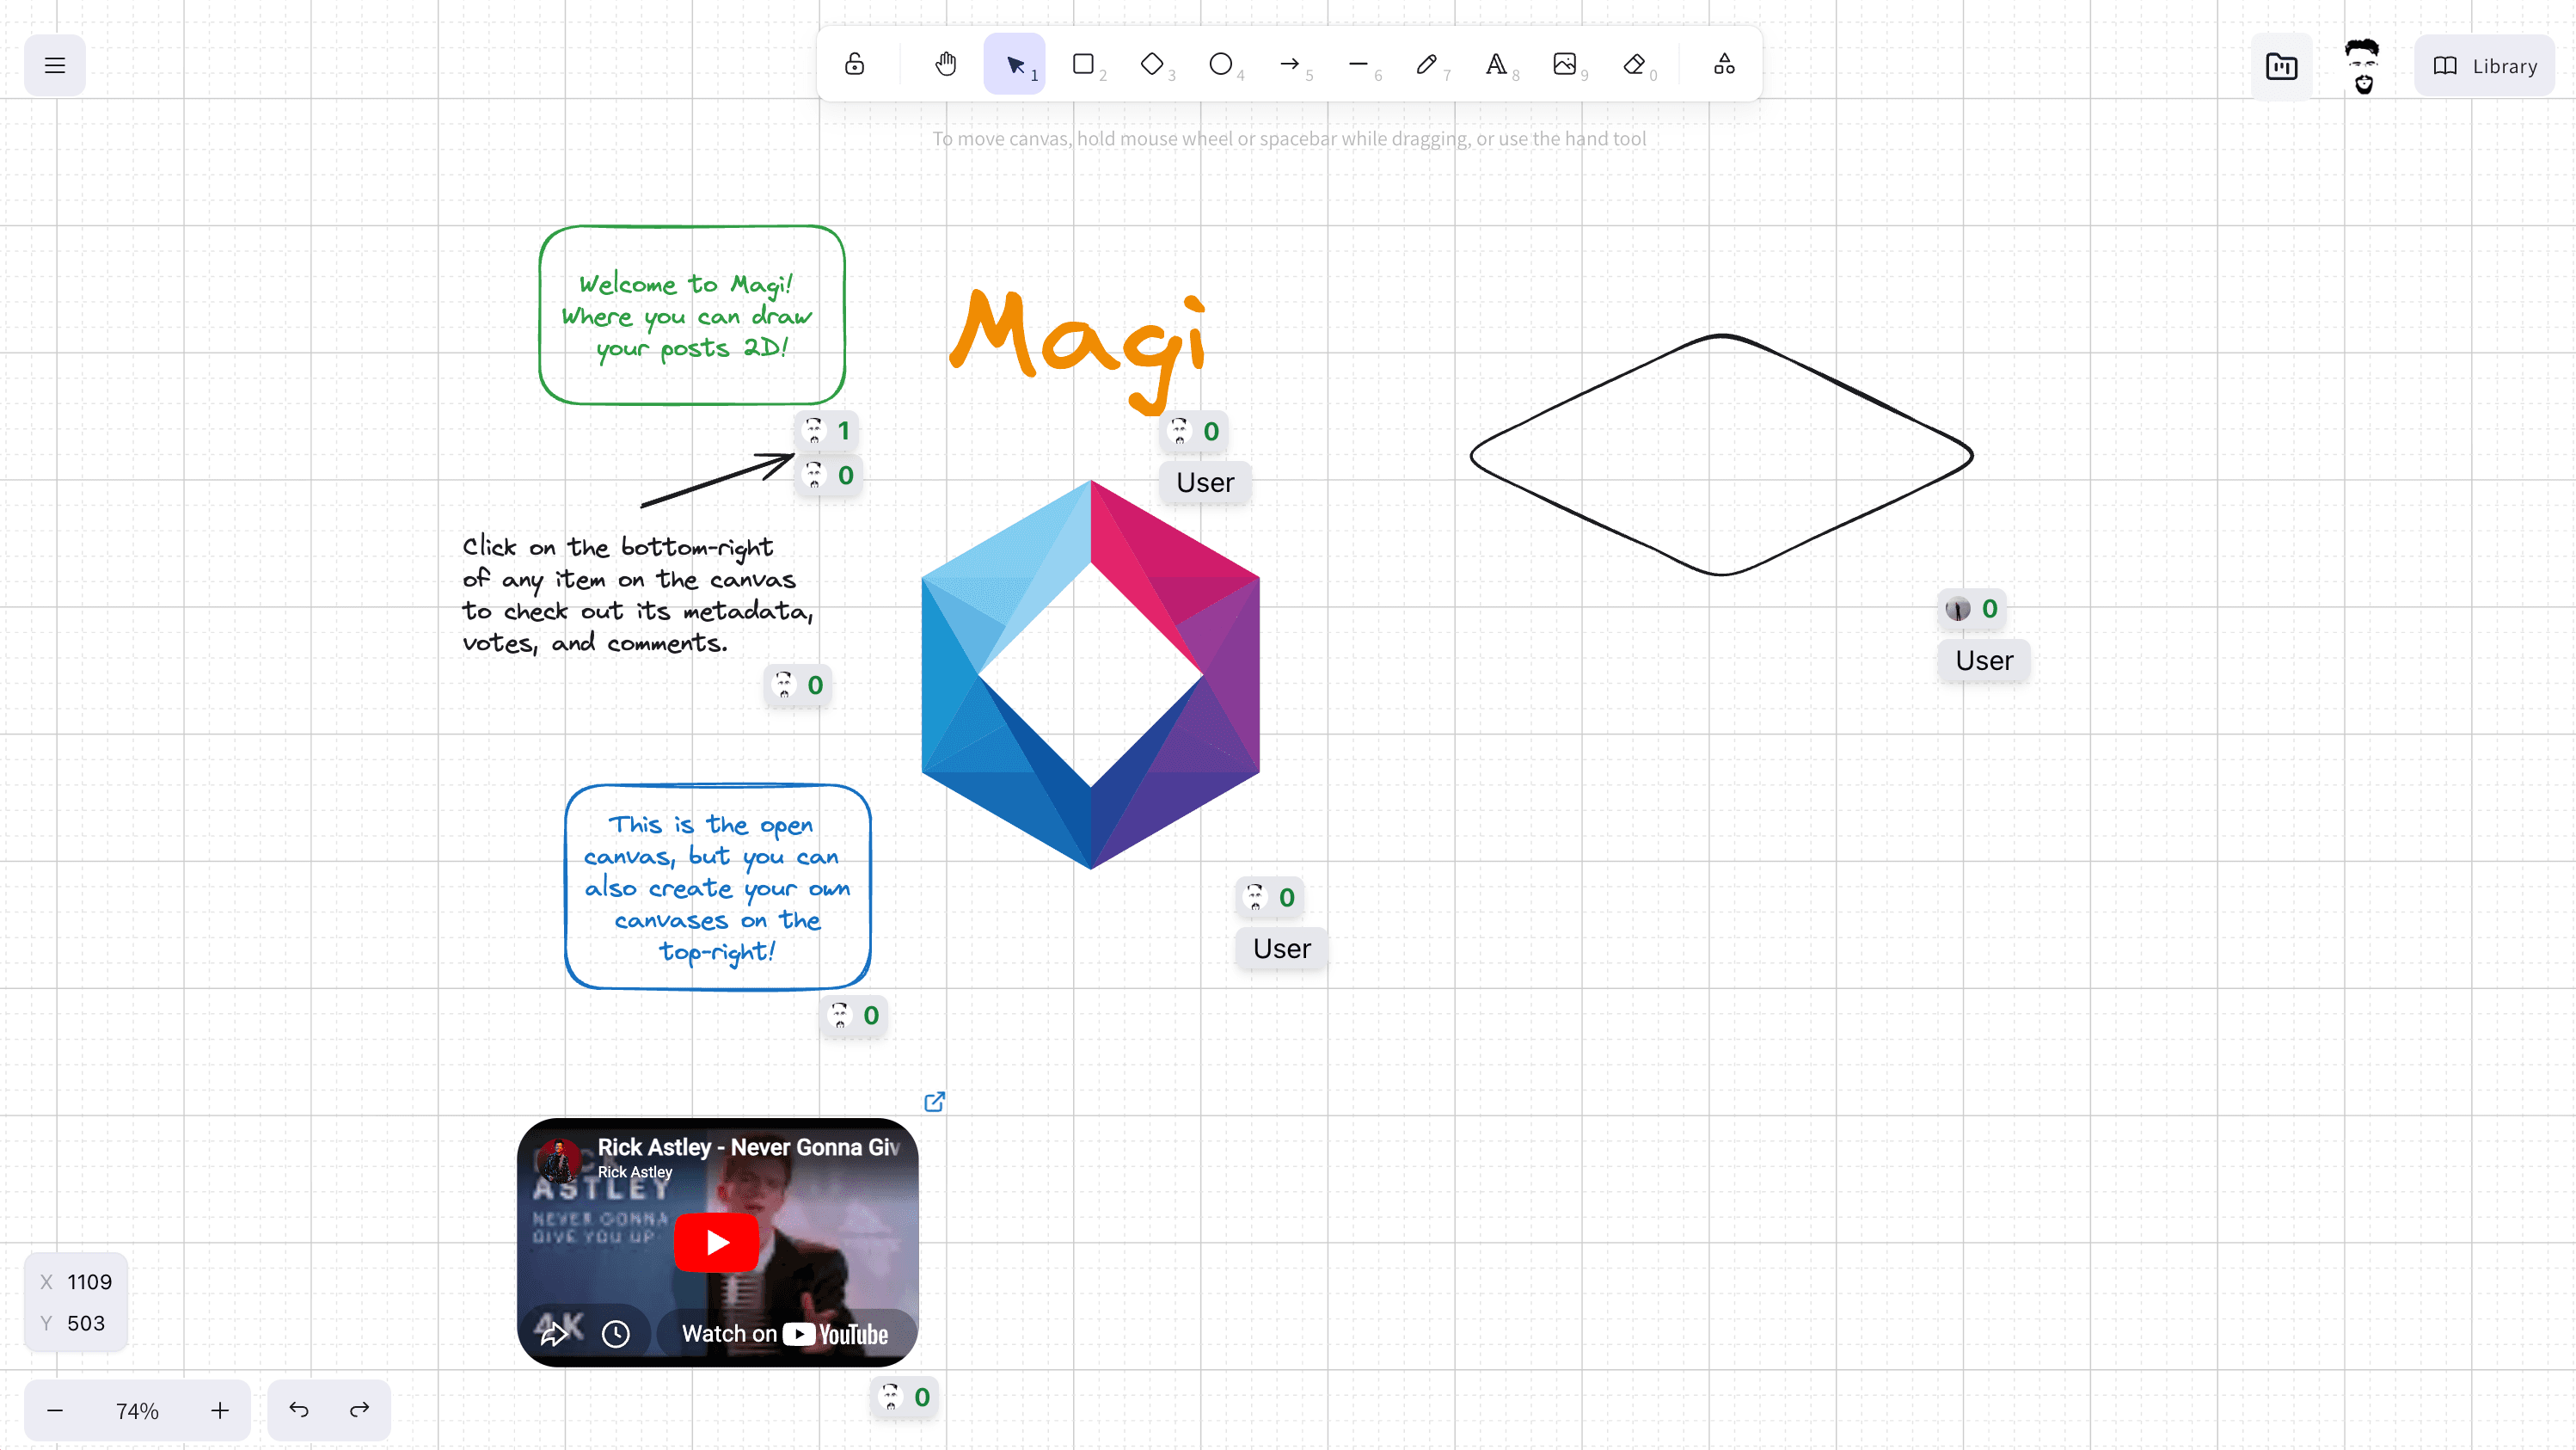
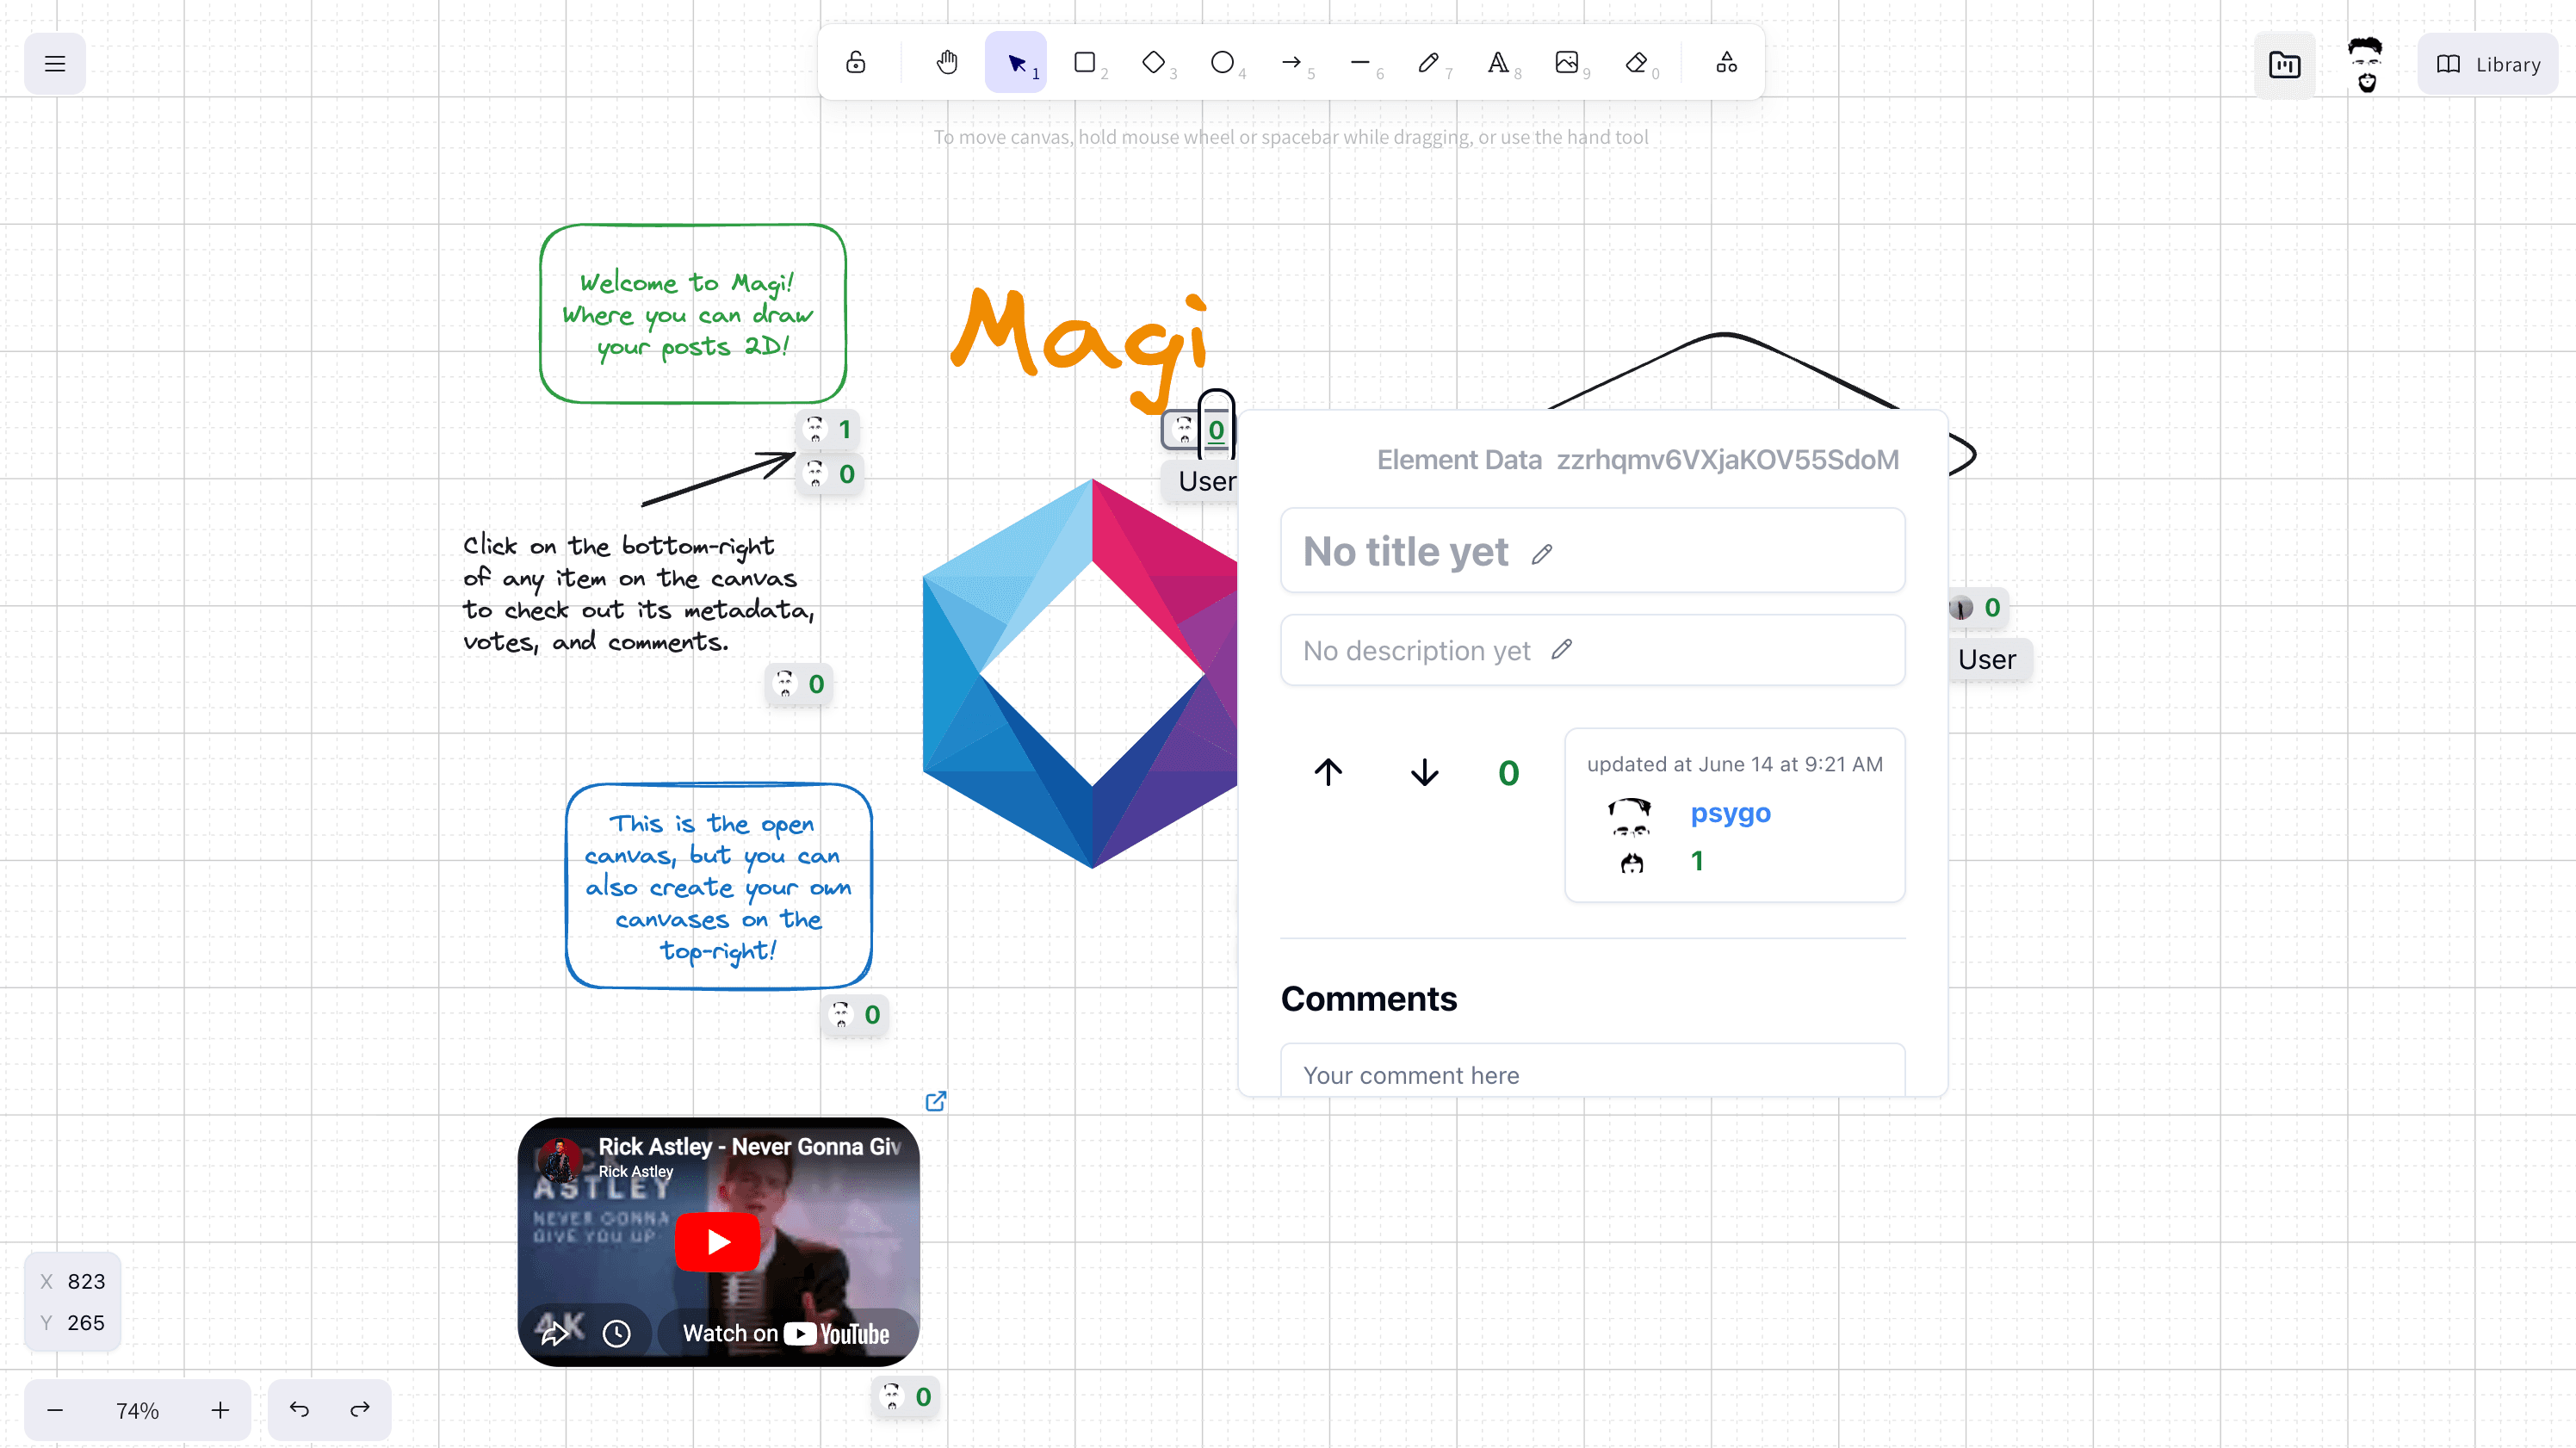
Magi is essentially a 2D version of Reddit, in which users create posts on a canvas and use different visual elements to relate them. Take a look:
Visualizing the web as a graph is nothing new, but having but having a tool which lets you do it with other users is something I had never seen and wanted to have become a reality.
Technical Challenges
Magi is open source: @psygo/magi
Building Magi was not easy. I had to exploit every single React trick I knew and more, but, thankfully, the outstanding Excalidraw package saved a colossal amount of time and effort.
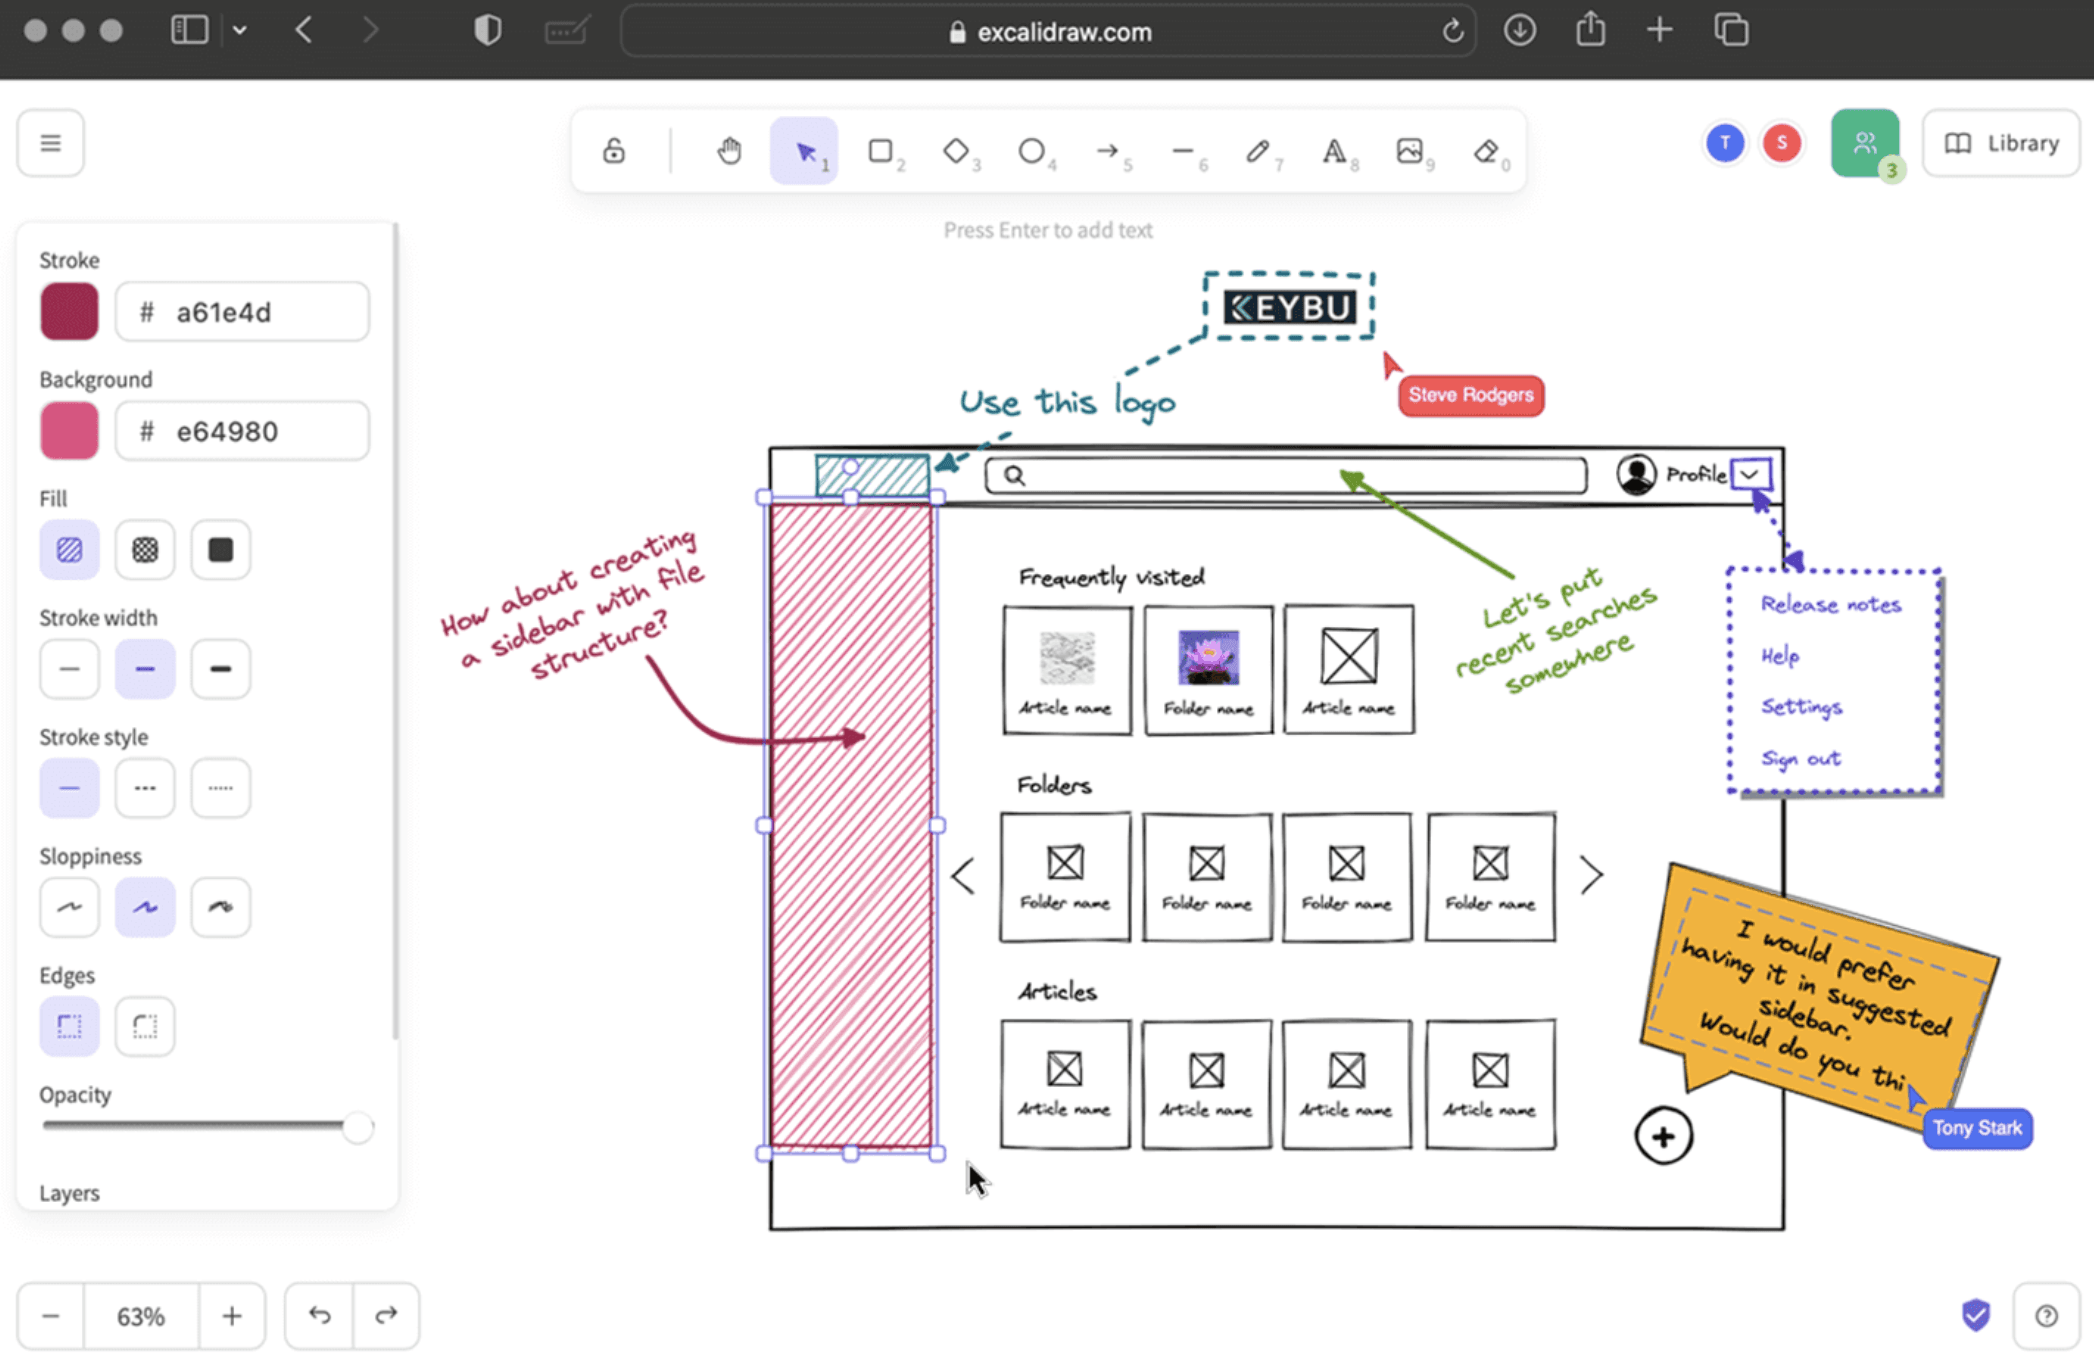
Excalidraw
In the end, the app's structure consists of an HTML <canvas> layer — handled by Excalidraw — and a regular HTML one. In many ways, Magi simply extends Excalidraw to become more socially interactive.
The orchestration of all elements was quite the challenge, especially the pagination, which you can inspect here.
However, maybe this project's toughest aspect was using a relational database to handle what should be in a graph database, such as Neo4j. The resulting schema was much simpler than I ever expected, but that needed many prior failed attempts with many different tools to ever become a reality.
Neo4j seemed like a perfect solution at the beginning, but its performance as a front-facing database did not convince me, it doesn't seem to scale to direct users. Since Neo4j is by far the most advanced graph database still, that DB category is for sure many decades behind the typical relational ones.
One of the most famous applications of treating the web as a network was Google's PageRank, which used collected data to create a usage graph for each website in the net. One possible visualization of that approach of the current state of the internet is The Internet Map.
Comments
You need to sign in to comment.
No comments yet.